| Vasona, frequently asked questions | |||||||||||||||||||
| Question | Answer | ||||||||||||||||||
| The following page covers, frequently asked questions which have been received, we feel that similar questions will require answering by other engineers and users. | |||||||||||||||||||
| Subject Area : Frequency Range | |||||||||||||||||||
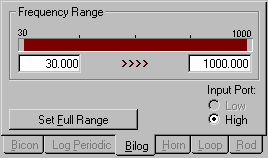
| How do I set the start and stop frequency of the scan ? | Simply
load the the Sweep/Setup up window, select sweep details and then enter the
start/stop frequencies. A more detailed explanation is as follows:-
1. Load Sweep Window
2. Sweep Tab
Once you have performed this, select either,
apply or ok to make the range active. |
||||||||||||||||||
| Why are additional steps required during a test, other than the number I have selected ? | Additional
scans may be required to cover the desired frequency for the following reasons:- 1. Limitations of spectrum analysers Spectrum Analyser may have input limitations dependent upon the range.A good example of this is the HP8563EM which can not sweep across 2.9GHz [approx.] hence if you define a scan from 1 to 4GHz utilizing one 3GHz step, then Vasona will actually perform 2 scans:- 1.0GHz
>> 2.9GHz 2. IF Bandwidth requirements
|
||||||||||||||||||
| Why do I get messages about "frequency limitation" every time I run a test ? | Vasona
will only allow you to perform a valid scan dependent upon the frequency range
of the main transducer, specification limit and the capability of the spectrum
analyser. If any of these parameter limit the desired frequency range then
Vasona will warn
you. To remove these messages, ensure that the desired range is covered by the all aspects of the set up. For example GR1089 requires emissions to 10GHz, an HP8546A has a upper frequency limitation of 6.5GHz. Hence if the actual specification limit datatable/file is 10GHz, Vasona will warn you that you can not perform the test fully, hence if you are doing this test often we suggest that you generate an actual file with a limit on 6.5GHz to stop this warning message. |
||||||||||||||||||
| Subject Area : Finding Peaks | |||||||||||||||||||
| If I have performed a preview scan without the "find" peaks option turned on, how can I get this data without 'repeating' the scan ? | From
the results window select the following:-
1. Functions |
||||||||||||||||||
| Why did Vasona not find any peaks ? | There
can be many reasons for this, these are the most likely ones:- 1. Captured worst case data. During the debug cycle, Vasona stores all the relevant data and then finds the peaks from this stored data. If the horizontal data [for example] is lower than the vertical trace, Vasona will only find the vertical data. Hence if you require the frequency and amplitude information from the horizontal trace, perform the find peaks function on trace 1. 2. Margin Function The margin function operates defining negative signals being below the relevant specification. Hence if you set this value positive of +5dB [for example] and no emission values fail the limit by more than 5dB then no peaks will be found. Therefore +ve signals fail the limit and -ve signals pass the limit. 3. Stores in debug list only During operation the find peaks function only stores initial peak data in the debug list, your may be looking at the formal peak section. This confusion could arise because during an assessment if you ask Vasona to measure both the emission profile and the formal peaks, it will copy the peaks from the debug list to the formal peaks list ! During an emission profile assessment "only" test, the peaks are just store in the debug list. |
||||||||||||||||||
| Subject Area : Signal/Data manipulations | |||||||||||||||||||
| How can I add a frequency to the list ? | There
are several methods available:- 1. From the clipboard If you have copied a signal from a table, use the "insert paste" function to insert the contents of the clipboard to the relevant table, see Vasona Training !, for an example of this operation. 2. Typing Selection of the "Add Freq" function
will insert the current marker frequency as an emission in the specified list
[default debug]. |
||||||||||||||||||
| How can I update the frequency of an emission ? | There
are several ways to update a given frequency, details are as follows:- 1. Typing Simply click on the relevant signal, under the "frequency" column and type in a value ! A check is performed to ensure you do not accidentally perform this function. Note : in earlier revisions of the software you had to do a 'Ctrl E' to manipulate a given frequency. 2. From the spectrum analyser You can update current frequency using the "Update frequency" button. An excellent discussion of this is given in XXXXXXX. |
||||||||||||||||||
| How do I simply measure one frequency using the "formal test" process ? | 1.
Select a relevant emission, ie left mouse button click anywhere on the emission
result. 2. Right mouse button click. 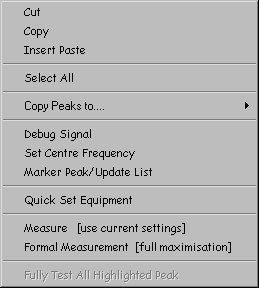
3. Select "Formal Measurement [Full Maximisation]. Vasona
will now perform a "Full Formal Measurement" routine. |
||||||||||||||||||
| How do I transfer peaks from the debug list to the formal list ? | An excellent example of this is found at Vasona Training ! | ||||||||||||||||||
| How can I quickly set the equipment [antenna, turntable ..] back to the worst case settings given in the list ? | 1.
Select a relevant emission, ie left mouse button click anywhere on the emission
result. 2. Right mouse button click. 
3. Select "Quick set equipment" from the selection above. Vasona
will set the following to the status given in the list. |
||||||||||||||||||
| How can I sort the emission list in "reverse margin" order, ie the least significant signal is first in the list ? | 1.
Hold down the Shift Key 2. Click on the Margin Column. |
||||||||||||||||||
| Subject Area : Graphs | |||||||||||||||||||
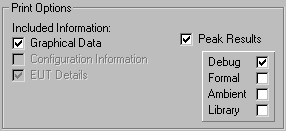
| Can I print the graph without the peaks ? | You
can print without any peaks indicated on the graph, to change printing options
use the following:- 1. Load the sweep details window. 2. Select the Misc TAB
3. Ensure the "Peak Results" option
is not selected, here it is selected..
|
||||||||||||||||||
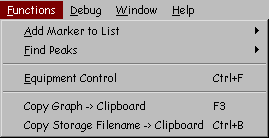
| Can I copy the graph to the clipboard ? | From
the results window select the following:-
1. Functions |
||||||||||||||||||
| The plots of maximised data, how can I keep a copy ? | You
can copy these to the clipboard and paste the results into word processors and
spreadsheets ......... From the "Open Site Control" window, select 1. Form 2. Copy 3. Copy Tower Graph > Clipboard, or Copy Turntable Graph > Clipboard. Then paste graph to the given application. |
||||||||||||||||||
| Subject Area : File handling | |||||||||||||||||||
| I can not retest using an archive file, why not ? and what can I do to get around the problem ? | There
is no option to "SAVE AS" using archive data, this is because the test
results do not contain all the relevant test perimaters to ensure that the
status of Vasona
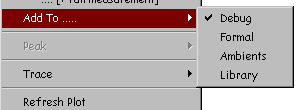
is identical to that used during testing. If you are confident that using the results would be valid you can perform the following functions to "re-establish". 1. Configure Vasona as it was during the previous test. 2. Open the "Archive File" 3. Copy and paste the results table from "Archive" to current results table 4. Copy and paste the trace information from "Archive" to current graph. This can be performed using the "Right" mouse button click when the cursor is over the graph. Select From the archive file:- |
||||||||||||||||||
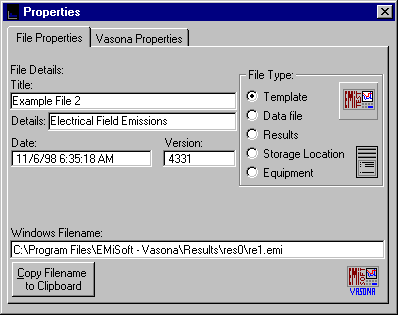
| How do I find out the actual filename of a given set of results ? | 1.
From the main Vasona
Menu, Select "View Details" [if required]. 2. Select the Radiated TAB. 
3. Whilst over one of the results ICONs
[example file 2], click on the right mouse button:- 4. From the available options, select
"Properties":- The filename is given in the "Windows Filename" text box.
|
||||||||||||||||||
| How can I open a file which has been attached on an email ? | There
are several way to achieve this, one of them is the following:- 1. From the main Vasona Menu, Select "View Details" [if required]. 2. Select the Radiated TAB. 
3. Whilst over one of the results ICONs
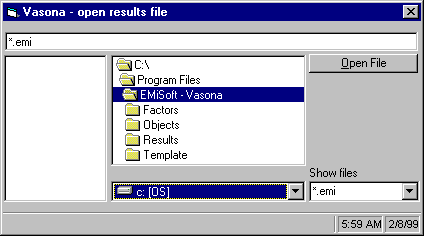
[example file 2], click on the right mouse button:- 4. Select Open From Another Location. Scroll through the directory structure until
you find the relevant file, then click on "Open file". |
||||||||||||||||||
| The other details.... |
| HDR.Expert, EMiSoft © 1997-2019 [Trademarks mentioned herein are the property of their respective owners.] |


![Right mouse button click options [on the graph]](../../../gifs/vasona105.gif)
![File options [right mouse button click]](../../../gifs/vasona113.gif)
